The UX Designer Job Outlook: What BLS's 7% Growth Number Isn't Telling You
If you’ve searched “ux designer job outlook” at 1am trying to decide whether to keep going, you’ve probably found two contradictory answers and no way to reconcile them.
The Bureau of Labor Statistics tracks this field directly, under the unglamorous name “Web and Digital Interface Designers,” and projects 7% employment growth by 2034, “much faster than average.” Indeed Hiring Lab doesn’t track design at all. Its closest available postings data are two unrelated sectors standing in for it, and those are still running 19 to 24% below where they sat in February 2020, more than six years later. One number is real, direct data filed under a name you’ve never heard. The other is a rough proxy for a category that doesn’t officially exist. Each one holds up on its own terms. Neither describes your search by itself.
In this post
What BLS’s Web and Digital Interface Designers data actually measures, what Indeed’s closest hiring proxies say about right now, what people searching are actually reporting, and why a growing occupation can still feel like a brutal job search right now.
Neither source is wrong. They’re measuring different things on different timelines, and untangling that mismatch means starting with the number most people assume doesn’t really exist.
What BLS actually measures
Start with a fact that surprises most people who check: there is no occupation at the Bureau of Labor Statistics called “UX Designer.” Never has been. But that’s a naming problem, not a data problem. BLS tracks this work closely, under SOC 15-1255, “Web and Digital Interface Designers.” It just doesn’t get a standalone writeup in the Occupational Outlook Handbook. BLS profiles it jointly with Web Developers (SOC 15-1254) under one combined heading, “Web Developers and Digital Designers,” even though the wage and employment tables report 15-1255 on its own.
It’s bureaucratic lag: a decades-old federal classification system still catching up to a job title that barely existed when it was designed. Close enough to be useful, real and direct data about the work, even without an exact match to the job title.
Indeed has the opposite problem, and a bigger one. It has no “design” sector at all, official or otherwise. The closest things it tracks are “Software Development,” which skews toward engineering, and “Arts & Entertainment,” which skews toward creative and media work broadly. Design sits in the gap between them, so the hiring numbers later in this post are two adjacent sectors standing in for one that goes unmeasured. That’s a proxy for design, at best.
Most coverage of this topic pretends one of those two numbers is a clean stand-in for “UX designer.” Showing you where each one bends instead means you can weight them correctly rather than grabbing whichever one confirms what you already believed walking in. That’s the job the design job market dashboard does, sourced and updated, if you want to sit with the charts yourself.
| BLS Employment Projections | Indeed Hiring Lab (design proxies) | |
|---|---|---|
| What it measures | 10-year structural forecast | Real-time postings, updated weekly |
| Latest read | +7% growth, 2024–2034 | Software Dev −24%, Arts & Ent −19% vs. Feb 2020 |
| Update cycle | Revised once every 2 years | Weekly |
| Exact match to “UX designer”? | No: SOC 15-1255, joint OOH listing | No: closest available proxies only |
The Web and Digital Interface Designers job outlook, straight from BLS, is a solid number. As of 2025, BLS’s Occupational Employment and Wage Statistics counts 113,330 people working as Web and Digital Interface Designers nationally, earning a median $104,000 a year, with the middle 80% landing between $53,750 and $201,550 depending on seniority and market.
The separate Employment Projections program expects that headcount to grow 7% between 2024 and 2034, adding roughly 9,100 openings a year once you count replacements, not just net-new roles. BLS calls that “much faster than average,” and by its own math it is: total U.S. employment across every occupation is projected to grow just 3.1% over the same decade, a slowdown from the 13.0% the economy managed between 2014 and 2024. That’s outrunning a labor market BLS already expects to be sluggish. It’s real growth, even if not the 2015-era boom people remember.
Every figure here is one piece of a ten-year forecast, not a live reading. Full breakdown, updated live: design job market dashboard →
That median hides a wide spread. Here’s the full percentile curve, from the 10th to the 90th:
Annual wage, 10th to 90th percentile — Web & Digital Interface Designers
One bar, four brackets, sized to the actual dollar range each one covers: $53,750 at the 10th percentile to $201,550 at the 90th, a spread of more than $147,000. The 50th-to-75th bracket is the widest jump in the whole range — seniority and specialization matter more than any other single factor here. Source: BLS OEWS, 2025.
That national number isn’t spread evenly, either. BLS breaks this occupation down by state and metro area, both by concentration (how many of these jobs exist per 1,000 total jobs in that market) and by pay, and the two rankings mostly agree with each other: the tech hubs you’d guess cluster the most of these roles also tend to pay the most for them.
| Metro area | Jobs per 1,000 (concentration) | Median annual wage |
|---|---|---|
| Seattle-Tacoma-Bellevue, WA | 4.95 | $133,760 |
| San Jose-Sunnyvale-Santa Clara, CA | 3.88 | $201,260 |
| San Francisco-Oakland-Fremont, CA | 2.79 | $163,810 |
| Boulder, CO | 1.85 | $139,900 |
| New York-Newark-Jersey City, NY-NJ | 1.58 | $119,190 |
| Durham-Chapel Hill, NC | 1.49 | $133,340 |
Same pattern at the state level: Washington has the highest concentration of these jobs of any state, 3.26 per 1,000, and California pays the most, a $136,110 median. Washington, California, and New York all land near the top of both lists. If you’re deciding where to point a search, or whether to relocate for one, that’s worth weighing. It’s a wider spread in opportunity than the single national median lets on.
Industry matters just as much as geography. BLS also breaks this occupation’s wages down by industry, and the top of that list isn’t just software and media companies. It’s search and information platforms, financial services, and hardware manufacturers, organizations where design work sits close to the product itself rather than being treated as a support function:
| Industry | Annual 90th percentile wage |
|---|---|
| Web Search Portals, Libraries, Archives, and Other Information Services | $265,480 |
| Specialized Design Services | $225,490 |
| Media Streaming Distribution Services, Social Networks, & Other Media Networks & Content Providers | $221,740 |
| Securities, Commodity Contracts, and Other Financial Investments and Related Activities | $219,170 |
| Computing Infrastructure Providers, Data Processing, Web Hosting, and Related Services | $216,640 |
| Scientific Research and Development Services | $214,700 |
| Semiconductor and Other Electronic Component Manufacturing | $214,120 |
| Software Publishers | $213,820 |
| Nondepository Credit Intermediation | $213,730 |
| Computer and Peripheral Equipment Manufacturing | $213,510 |
| Electronics and Appliance Retailers | $211,510 |
| Navigational, Measuring, Electromedical, and Control Instruments Manufacturing | $210,890 |
| Audio and Video Equipment Manufacturing | $208,520 |
| Professional and Commercial Equipment and Supplies Merchant Wholesalers | $208,360 |
| Monetary Authorities-Central Bank | $204,590 |
The 90th percentile is the ceiling, so read this as where the top of the pay range gets pulled highest, rather than what most roles in these industries typically pay. Still, finance, semiconductor manufacturing, and scientific R&D sitting this close to software and media at the top of that ceiling says something: the industry you’re in can move your pay as much as the state you’re in does. Source: BLS OEWS, 2025.
How much weight to put on that number depends on where it comes from. BLS’s Employment Projections are revised once every two years, built from demographic trends, industry growth patterns, and an assumption that technological disruption keeps moving at roughly its historical pace, not however fast this particular wave of AI turns out to be moving. That’s a defensible modeling choice. It’s also the exact assumption the last few years are best positioned to test.
The lag is real, too. The 2024–2034 projections weren’t published until August 28, 2025, eight months into that year and well over a year into the decade they claim to forecast. Indeed’s dashboard updates on a rolling weekly basis, by comparison. These two sources run on entirely different clocks by design, not because one is running late and the other early.
BLS isn’t blind to AI, either. Computer and mathematical occupations as a group are projected to grow 10.1% over the same decade, faster than design’s 7%, with AI adoption named as part of the driver, and data scientists are projected at 33.5%.
On the other side, BLS expects AI-driven productivity gains to shrink demand for several office and administrative roles. The agency published a dedicated study in February 2025 on incorporating AI into specific occupational projections, covering computer, legal, financial, and engineering occupations. Whether that AI-adjusted treatment covered Web and Digital Interface Designers too, or whether its 7% is a more general historical-trend extrapolation, isn’t something I can confirm from what BLS has published. Better to leave it unresolved than hand you a confident answer I can’t back up.
| All U.S. occupations | 3.1% |
|---|---|
| Web & Digital Interface Designers | 7% |
| Computer & mathematical occupations | 10.1% |
| Data scientists | 33.5% |
Design’s 7% outpaces the 3.1% BLS projects for the entire U.S. economy over the same decade, but it trails computer and mathematical occupations broadly, and data scientists by a wide margin. Source: BLS Employment Projections, 2024–2034.
What the hiring data says is happening right now
Zoom into this year and the picture flips. Indeed Hiring Lab tracks a weekly postings index against a February 2020 baseline set near 100. Across all industries, that index sits at 102.1 as of July 31, 2026, fully recovered. The two proxies closest to design tell a different story. Software Development postings, where a lot of product and UX work gets bucketed alongside engineering, sit at 75.46, down roughly 24% from baseline. Arts & Entertainment, the closer proxy for creative and brand-side design work, sits at 81.13, down about 19%.
Posted wage growth is running around 2.3 to 2.4% year over year, basically tracking inflation rather than beating it. Remote and hybrid share has climbed a long way since January 2019, when it sat at 2.48%, but it’s plateaued around 8.6% over the last couple months of available data instead of continuing to climb.
| All industries | +2.1% |
|---|---|
| Software Development (design proxy) | −24% |
| Arts & Entertainment (design proxy) | −19% |
Postings across all industries have fully recovered to their pre-pandemic level. The two closest available design proxies haven’t — both are still well below where they sat in February 2020, more than six years later. Source: Indeed Hiring Lab, accessed Jul 31, 2026.
That figure isn’t a design-specific number either, for the same reason BLS’s classification above isn’t an exact match: Indeed doesn’t track a design sector at all. Software Development and Arts & Entertainment are the closest available stand-ins, labeled as such on its own dashboard, one skewing toward engineering-adjacent roles and the other toward creative and media work broadly. You can watch both update live on the dashboard alongside the wage-growth and remote-share charts behind them.
Three separate sources, none of them Indeed, point the same way. That’s why I trust the direction of that data even with the proxy problem. ManpowerGroup’s Experis Tech Talent Outlook for Q1 2026 found U.S. tech employers’ Net Employment Outlook fell to 33%, a ten-point drop from the prior quarter and a 19-point drop year over year, landing the U.S. below the 35% global average for the first time. Even there, 49% of employers still planned to add staff against 16% expecting cuts, a real slowdown well short of a collapse.
The UXPA’s own salary survey, analyzed by MeasuringU, found 2024 hiring at surveyed design organizations came out net zero, staff added and staff lost dead even, the worst reading that survey has recorded, nominally worse than 2009.
AcademyUX’s job-market tracker, which pulls from Adzuna postings and layoffs.fyi rather than Indeed, logged a sharp one-month cooldown in its own design-specific numbers this past June. It’s a single noisy data point with a scoring method it doesn’t fully explain, worth mentioning but not a headline stat to build an argument on. Still, an employer-intentions survey, a professional association’s member survey, and a job-postings scrape all pointing the same direction as Indeed is a stronger signal than any one of them alone.
What people searching right now are saying
Spend ten minutes on r/UXDesign, though, and you’ll find what none of the numbers above capture: what searching the ux job market actually feels like from the inside. A specific post shape keeps repeating: someone announcing they landed a role after six months, seven months, eight months of looking. The same relief, the same disbelief, shows up again and again from different people, treated as a genuine milestone worth writing up. That’s not one outlier having a rough year.
Read past the headlines and the tone gets sharper, and it’s not unusual to find people asking outright, in exactly those words, whether UX design is dying. One meme stacks the complaints on top of each other: 1,072 applicants for a single posting, a decade of Figma experience expected, an unpaid junior position, seven rounds of interviews, layoffs, and AI folded in as one more thing candidates are competing against. It’s a joke, and it’s also a fairly accurate list of what people are running into.
Another post, from a designer the platform flags “Experienced,” calls the AI tools their company now mandates “parasites” and describes the job as offloading brainstorming, analysis, and research to something they don’t trust to do it well, with 754 upvotes and 200 comments’ worth of people apparently agreeing. That’s someone who’s done the work for years, describing what the day-to-day turned into.
 r/UXDesign · 134 votes · 52 comments
 r/UXDesign · 263 votes · 77 comments
 r/UXDesign · 289 votes · 64 comments
 r/UXDesign · 52 votes · 53 comments
 r/UXDesign · 45 votes · 28 comments
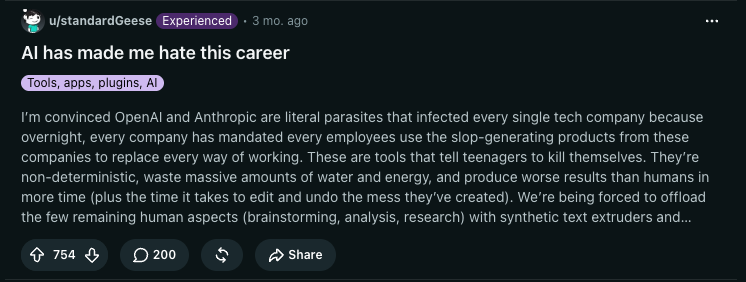 Reddit · 754 upvotes · 200 comments
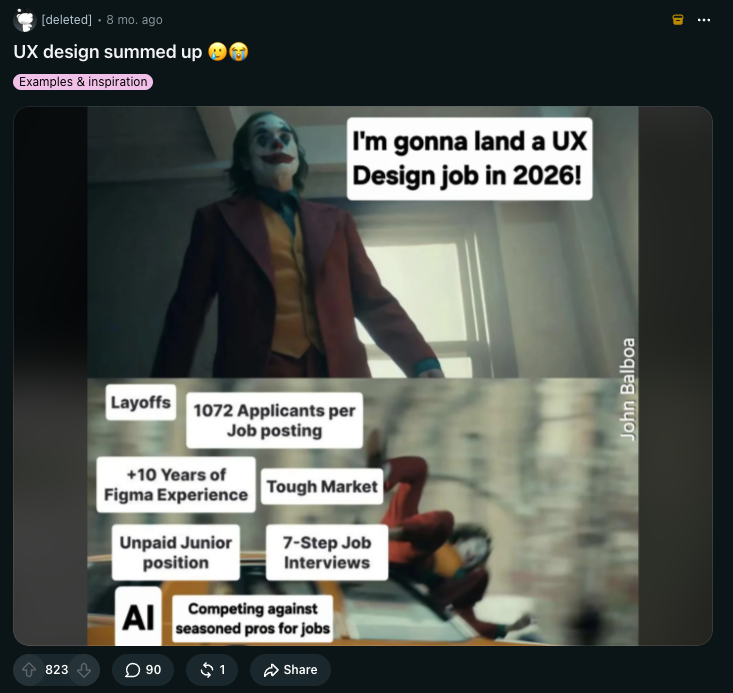 Reddit · 823 upvotes · 90 comments
Seven real posts, pulled from a few minutes of scrolling design subreddits in August 2026. Anecdotes aren’t data, and a handful of screenshots can’t be trended the way a BLS or Indeed series can. Treating a stack of upvoted threads as proof of anything on their own would repeat the exact proxy problem already flagged for BLS’s and Indeed’s numbers. What I can say is narrower: the shape of what people describe here, searches measured in months treated as wins just to end, absurd requirements stacked onto junior roles, real resentment toward how AI has entered the process, lines up with the direction Indeed’s numbers already pointed to. It’s a second, independent signal that the slowdown in the data shows up in people’s actual searches too, real enough to live through, well beyond a rounding artifact in a spreadsheet.
A ten-year growth forecast doesn’t cancel out an eight-month job search, and it shouldn’t have to. A field can be expanding in the aggregate while your particular search drags on for reasons that have nothing to do with its long-term trajectory.
Why both numbers are right at the same time
Both sources hold up under their own rules. The trouble starts the moment someone quotes one as if it answers the other’s question. They were built to answer different questions on different clocks.
BLS’s Employment Projections are a structural, decade-long bet: given demographic trends, industry growth, and an assumption that technological change keeps moving at roughly its historical pace, where does this occupation’s headcount land by 2034. It’s revised once every two years and published on a lag, which is exactly why the 2024–2034 numbers didn’t reach the public until eight months into 2025.
Indeed’s data is a cyclical, real-time instrument: what’s happening in postings, wages, and remote share this week, which picks up hiring freezes, layoffs, and AI-driven caution that a ten-year model was never built to register in the short run. A ten-year weather forecast and a look out the window can both be accurate and still tell you completely different things. The 7% is a reasonable bet about 2034. It says almost nothing about whether a recruiter writes you back this month.
I ran into a version of this same shape earlier this year, sliced along a different axis. Writing about what’s actually happening to entry-level design jobs, I found a healthy BLS number for the design occupation as a whole sitting right next to a much rougher one for people trying to break in at the bottom of it: entry-level graphic-design employment down nearly half between 2022 and 2025, while entry-level employment in the computer occupations group BLS files web and digital designers under held roughly flat.
Same mechanism, a healthy topline coexisting with real trouble in one slice of the same field, just sliced differently. That post is about who you are inside the occupation. This one is about when you’re asking the question.
Recruiting taught me that a company’s five-year headcount plan and this quarter’s actually-approved requisitions are two different documents, updated on two different clocks. The five-year plan says the department doubles by 2030. The quarterly reqs say hiring’s frozen until next quarter. Both documents live in the same shared drive at the same company, and neither one is fiction. BLS’s projection and Indeed’s postings index have almost exactly that relationship. One is the field’s long-range plan, the other this quarter’s actual reqs.
I made close to the same argument about the broader job market in a separate post about the quits rate: the official statistic can be accurate while your lived experience of the market is brutal, each one true without erasing the other. That’s two instruments pointed at two different timescales, and expecting them to agree is what makes people feel like they’re losing their minds over a spreadsheet.
Reflective Coda
If you’re deciding whether design is worth staying in, training into, or betting the next decade of your career on, weight BLS’s number more heavily. A $104,000 median, 113,330 people already working in the occupation, and growth outrunning a labor market expected to slow down anyway is a real, durable signal about the future of UX design, at least structurally. That’s the same evidentiary bar the rest of the dashboard holds itself to.
If you’re trying to figure out why your search feels like wading through wet sand right now, weight the Indeed side instead, along with the three independent sources that agree with its direction. Budgets are cautious, postings for the roles closest to design are still well under pre-pandemic levels, and wage growth in listings is barely keeping pace with inflation. That points to a slow stretch of hiring, for reasons that are cyclical and probably temporary, rather than a field that’s dying out.
Budget your search for a tough market. Plan for a longer timeline than the market rewarded three years ago, more competition per opening, and a real if uneven chance that things loosen before 2034 does anything at all. If the 7% growth number doesn’t match what your own search feels like this month, your instincts are fine. You’re just reading a different clock than the one your search runs on.
Next Sunday I’ll check both of those numbers again. The BLS number won’t move. It isn’t due for another revision for a while yet. The Indeed number will, like it always does, probably by a fraction of a point in one direction or the other. I’m not going to tell you which one to believe. I’m going to keep updating both, correctly labeled, so you can decide for yourself which clock you’re asking the time from.
Sources
- “Web and Digital Interface Designers” (U.S. Bureau of Labor Statistics, Occupational Employment and Wage Statistics, SOC 15-1255, 2025)
- “Web Developers and Digital Designers” (U.S. Bureau of Labor Statistics, Occupational Outlook Handbook)
- “Employment Projections — 2024–2034” (U.S. Bureau of Labor Statistics, news release USDL-25-1324, Aug 2025)
- “Projections Methodology” (U.S. Bureau of Labor Statistics, Employment Projections program)
- “Incorporating AI Impacts in BLS Employment Projections: Occupational Case Studies” (Christine Machovec, Michael Rieley & Emily Rolen, Monthly Labor Review, Feb 2025)
- “Artificial Intelligence, Information Technology, and Employment, 2024–34” (U.S. Bureau of Labor Statistics, Economics Daily, 2026)
- Job Postings and Hiring Data (Indeed Hiring Lab, accessed Jul 31, 2026)
- “Q1 2026 Experis Tech Talent Outlook” (ManpowerGroup)
- “How Does the UX Job Market Look for 2025?” (MeasuringU, analysis of UXPA Salary Survey 2024)
- “UX Job Market Update: June 2026” (AcademyUX, Jul 2026)